General Electric’s Jack Welch is famous for, among other things, firing the bottom 10% of employees every year. While Jack would be considered extreme for implementing a management strategy like this in today’s age, it highlights the need to audit performance throughout the company to ensure no team gets left behind.
That’s where our Internal Audit Evaluation Excel Template comes in handy. It systemizes your auditing processes, allowing you to manage and score specific departments based on organizational standards and checklists.
Starting from the Audit Database sheet, add your audit points and standards. Fields include Departments, Sections, Clause, Description, Target Score, Auditors, Limits and Visualization. Placeholders reflect common inputs for each column.
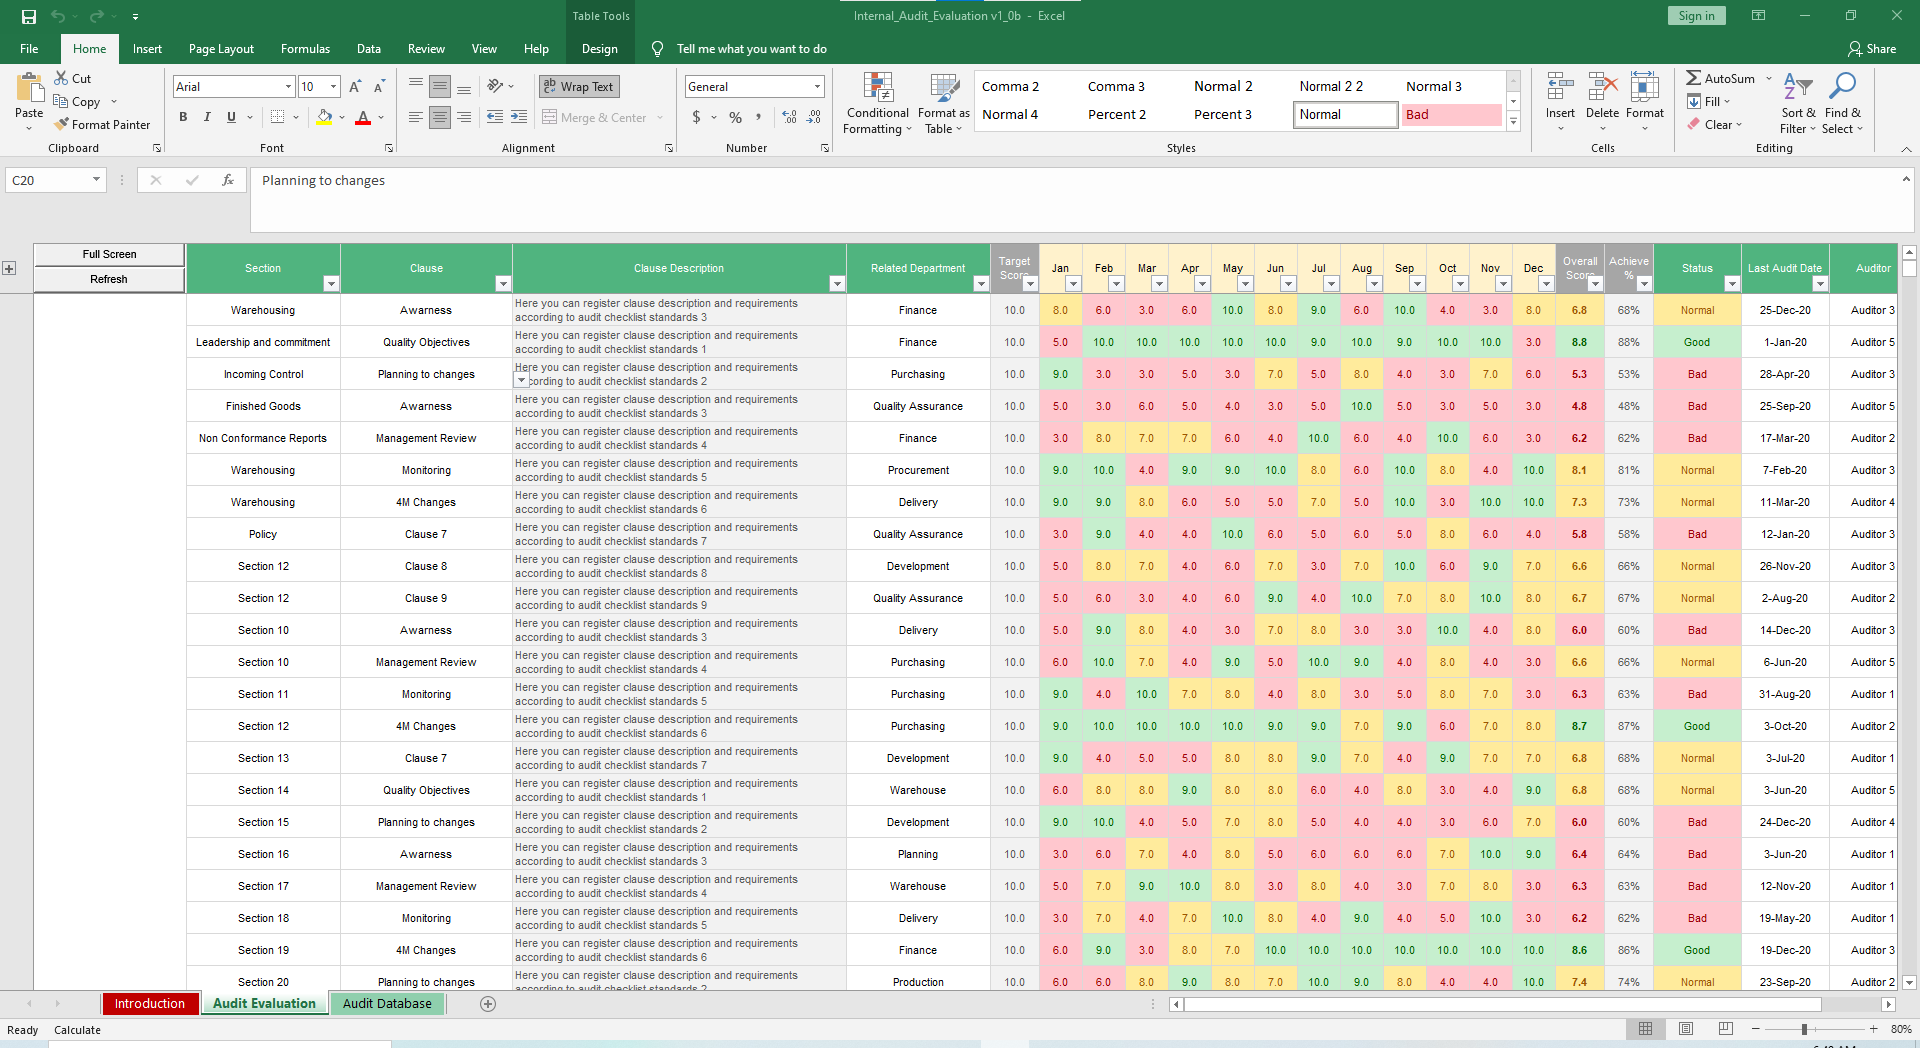
For Score Visualization, adjust your limits to organizational standards. This will make the table in the Audit Evaluation sheet easy to analyze as you can quickly see which audits resulted in a Normal or Bad score.
Let’s move over to the Audit Evaluation sheet. Record all Audit Sections from the drop-down list in the Section field. Select the Audit Cause according to the selected Section. The Clause Description and Target Score will be recorded automatically based on your prior inputs.
Now, select the Related Department for each Audit Section/Clause. For each Section/Clause, record the Monthly Score. It will automatically highlight based on the limits you entered in the Audit Database sheet.

For each Section/Clause, record the Last Audit Date, Auditor and the Last Comment/Observation to be reviewed.
You can view the Audit Dashboard by expanding the top zone using the expand sign + in the left side of the spreadsheet.
To maximize the display view for a presentation or report, click the Full Screen button. To update charts, trends and dashboard data source, click the Refresh Data button.
While we hope you don’t use this to axe people, we believe it’s a great tool for increasing awareness and tracking department performance.